

In dynamic real-time website personalization, the proof is in the pudding, and the only way to prove that one personalization technique or case is better than another is through a head-on comparison, otherwise known in the industry has A/B Testing. However, testing blindly can cost a company at the bottom-line in terms of valuable leads lost. How much are you willing to pay for absolute certainty? How do you find that sweet spot between simply going on intuition and strict statistical certainty?
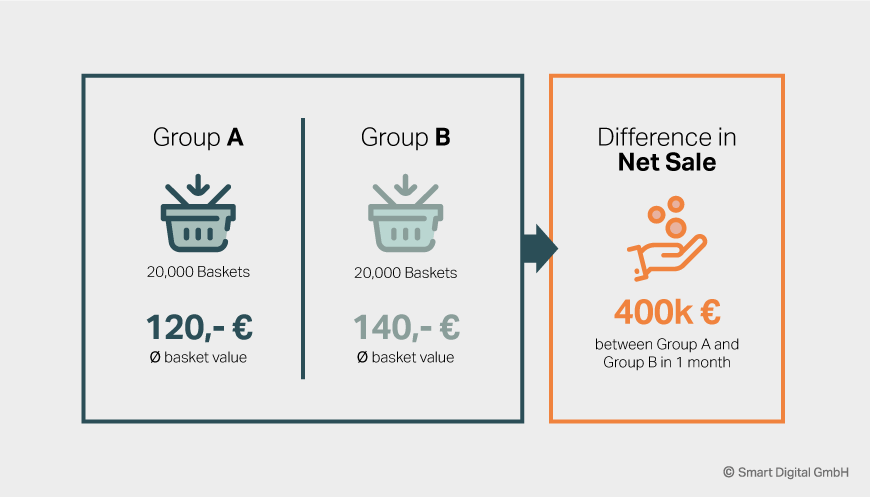
Let’s say you are testing two personalization actions on an e-commerce site in two evenly split group sizes. The average difference between the two groups’ basket values is 20 euros. However, it’s not yet ‘statistically significant’. You’ll probably need to run it for another 4 weeks for “statistical significance” given your current power calculations, and you have on average 20,000 baskets per month per group. You could be losing 400,000 euros (20,000 baskets *20 euros difference per basket) difference per month on lost sales simply by not turning off your A/B testing earlier.
I am a statistician; although my job title says “Data Scientist”, I am really a statistician in data scientist clothing. Statistics is the study of data; it is rooted in the understanding of the variance inherent to data. The rules one sees overall in Adobe Analytics or Google Analytics or any other off the shelf software recommends parameters such as 5% Type 1 error or 10% Type 2 error (Type 1 error being the probability there is no difference between the two groups but you still declare one, and Type 2 error being the probably there is a difference but you don’t see it). The 5% rule for statistical significance comes from clinical trials and medical studies; they typically require a Type 1 error of 5% or less to be considered “true”. Similarly, when planning study sizes, clinical studies require no more than 10% Type 2 error probability to be approved. On the flip side, that means that the power of study should be estimated to be at least 90% (Power is 1- Type 2 error). These stringent rules often require large sample sizes and consequently long run-times before a test is completed. However, website personalization is not the same as medical experiments; the health and well-being of living creatures do not hang in the balance.
Depending on the situation, a trend effect may already exhibit statistically relevant results at 10% Type 1 error rate; or using 80% Power may already be enough for decisive and also profitable decisions for website personalization. If after one month of running an AB test, you see that the p-value of your test is getting smaller and smaller, from 15% to 10% to 7.5%, then the trend is clearly going towards the threshold of 5% Type 1 error and statistical significance. In that case, a 7.5% p-value could be enough for you to make the final call and say ‘Yes, we will go the Group A personalization; we have enough evidence’. Look at the rate of traffic on the website, the spread or variance of the outcome you are measuring, and the statistical trend of the results.
Final Takeaway
Applying the rules blindly and dogmatically for the industry standard “statistically significant results at the 5% Type 1 error rate level” may give you an water-tight case for why you should choose A over B, but it may also cost your company large margins in profit or operating costs in lost leads, longer runtime of tests, and waiting endlessly for tests that might never be conclusive. Instead, consider the whole statistical picture of the AB test, especially when you are running multiple AB tests or engaging in multivariate testing. When in doubt, you can also hire a company like Smart Digital for such expertise. Variance in data is our bread and butter.
Photo: Pablo Garcia Saldana| Unsplash